Vision
Interactive Dashboards
Where Data Becomes Your Co-Pilot on the Road to Growth
Imagine a world where business decisions shift from educated guesses to strategic maneuvers fueled by real-time insights. Our vision extends beyond a single department. We believe in offering a holistic view of your entire business. Gain real-time visibility into your financial well-being, sales pipelines, production efficiency, and supply chain health – all within a single, intuitive interface. We don’t just present data; we transform it into actionable intelligence. Compare your performance against industry benchmarks and delve into insightful ratios derived from your income statement, balance sheet, and cash flow. Our Actuals vs. Budget Model dashboards go a step further, allowing you to dynamically analyze variances and identify areas for improvement.


Challenges
Worry-free Management
Are you tired of running to finalize your reports as the week and month reach their end? , fights with other departments every day? If yes, then you may be in need of structuring and organizing procedures and developing a professional Integrated Visualized Business Dashboard. From day-to-day transactions to generating accurate business and financial reports, and taking your time for looking to your report without any pressure, only at this point, your reporting will be stable and efficient, and don’t waste your time.
Contact USOur Insights Business Analyst and Decision Support
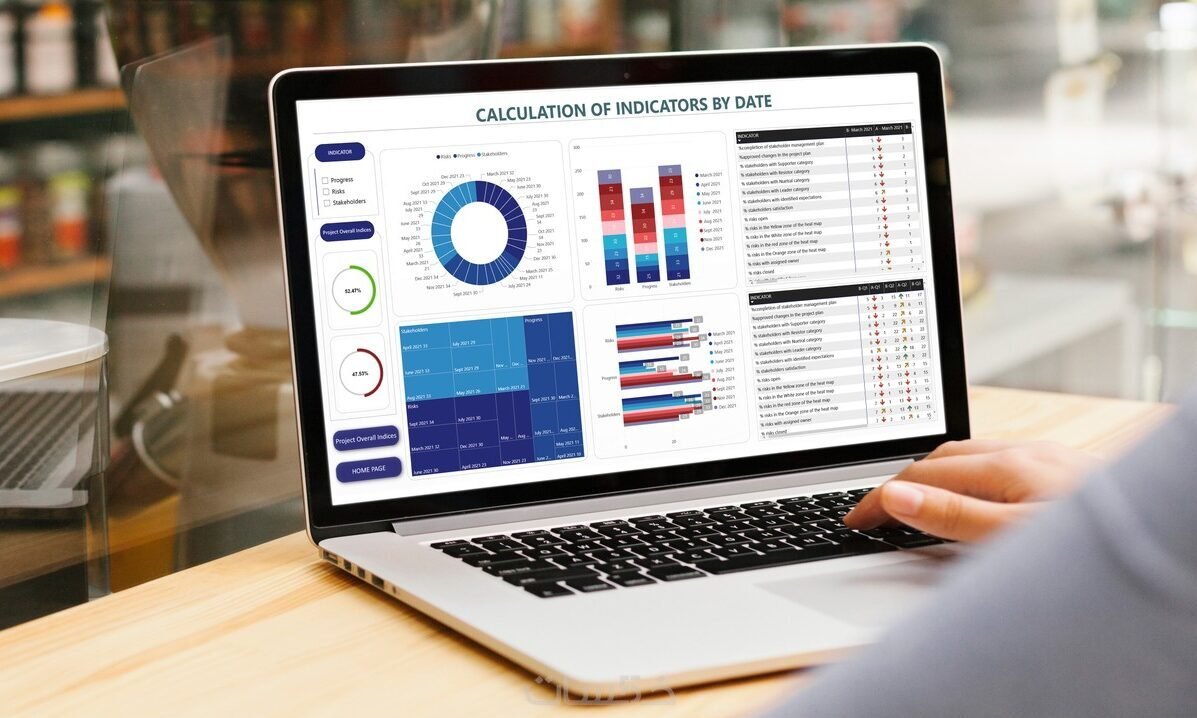
With the advent of Power BI based interactive management reports, companies can now gain deeper insights into their operations and make better decisions. with the development and design of management dashboards to be interactive and visualized, allowing managers to dig deeper into the data and information to identify trends and patterns, and take action based on those insights. these reports and dashboards can also provide analytics trends and outcomes more deeply, allowing companies to stay ahead of the competition.
In Additional ,We help you to monitor and cut down your maximum operational cost resulting in better business decisions with our exclusive business supporting services.EASE INSIGHTS BY INTERACTIVE DASHBOARD
Generate and develop monthly, weekly, or even daily, reports that are specific to your business and your current needs. The business service will examine the business and the industry and assist in designing the interactive dashboards. Based on these reports, it will become easier to understand the board of directors to take a decisions.
About UsOur Message
To the esteemed leaders, executives, and business owners
You drive the success of your organizations, we understand the critical role data plays in navigating today’s dynamic market , we’re passionate about empowering you with the tools you need to make informed decisions with confidence. Our vision goes beyond static reports, offering a personalized command center with interactive dashboards and insightful analysis. Imagine a platform that provides a holistic view of your entire business, from financial health to operational efficiency. This is the future of data-driven decision-making, and we’re here to be your partner on this journey of transformation.
Interactive Business Dashboards
Subscribe to our newsletter
Join Us
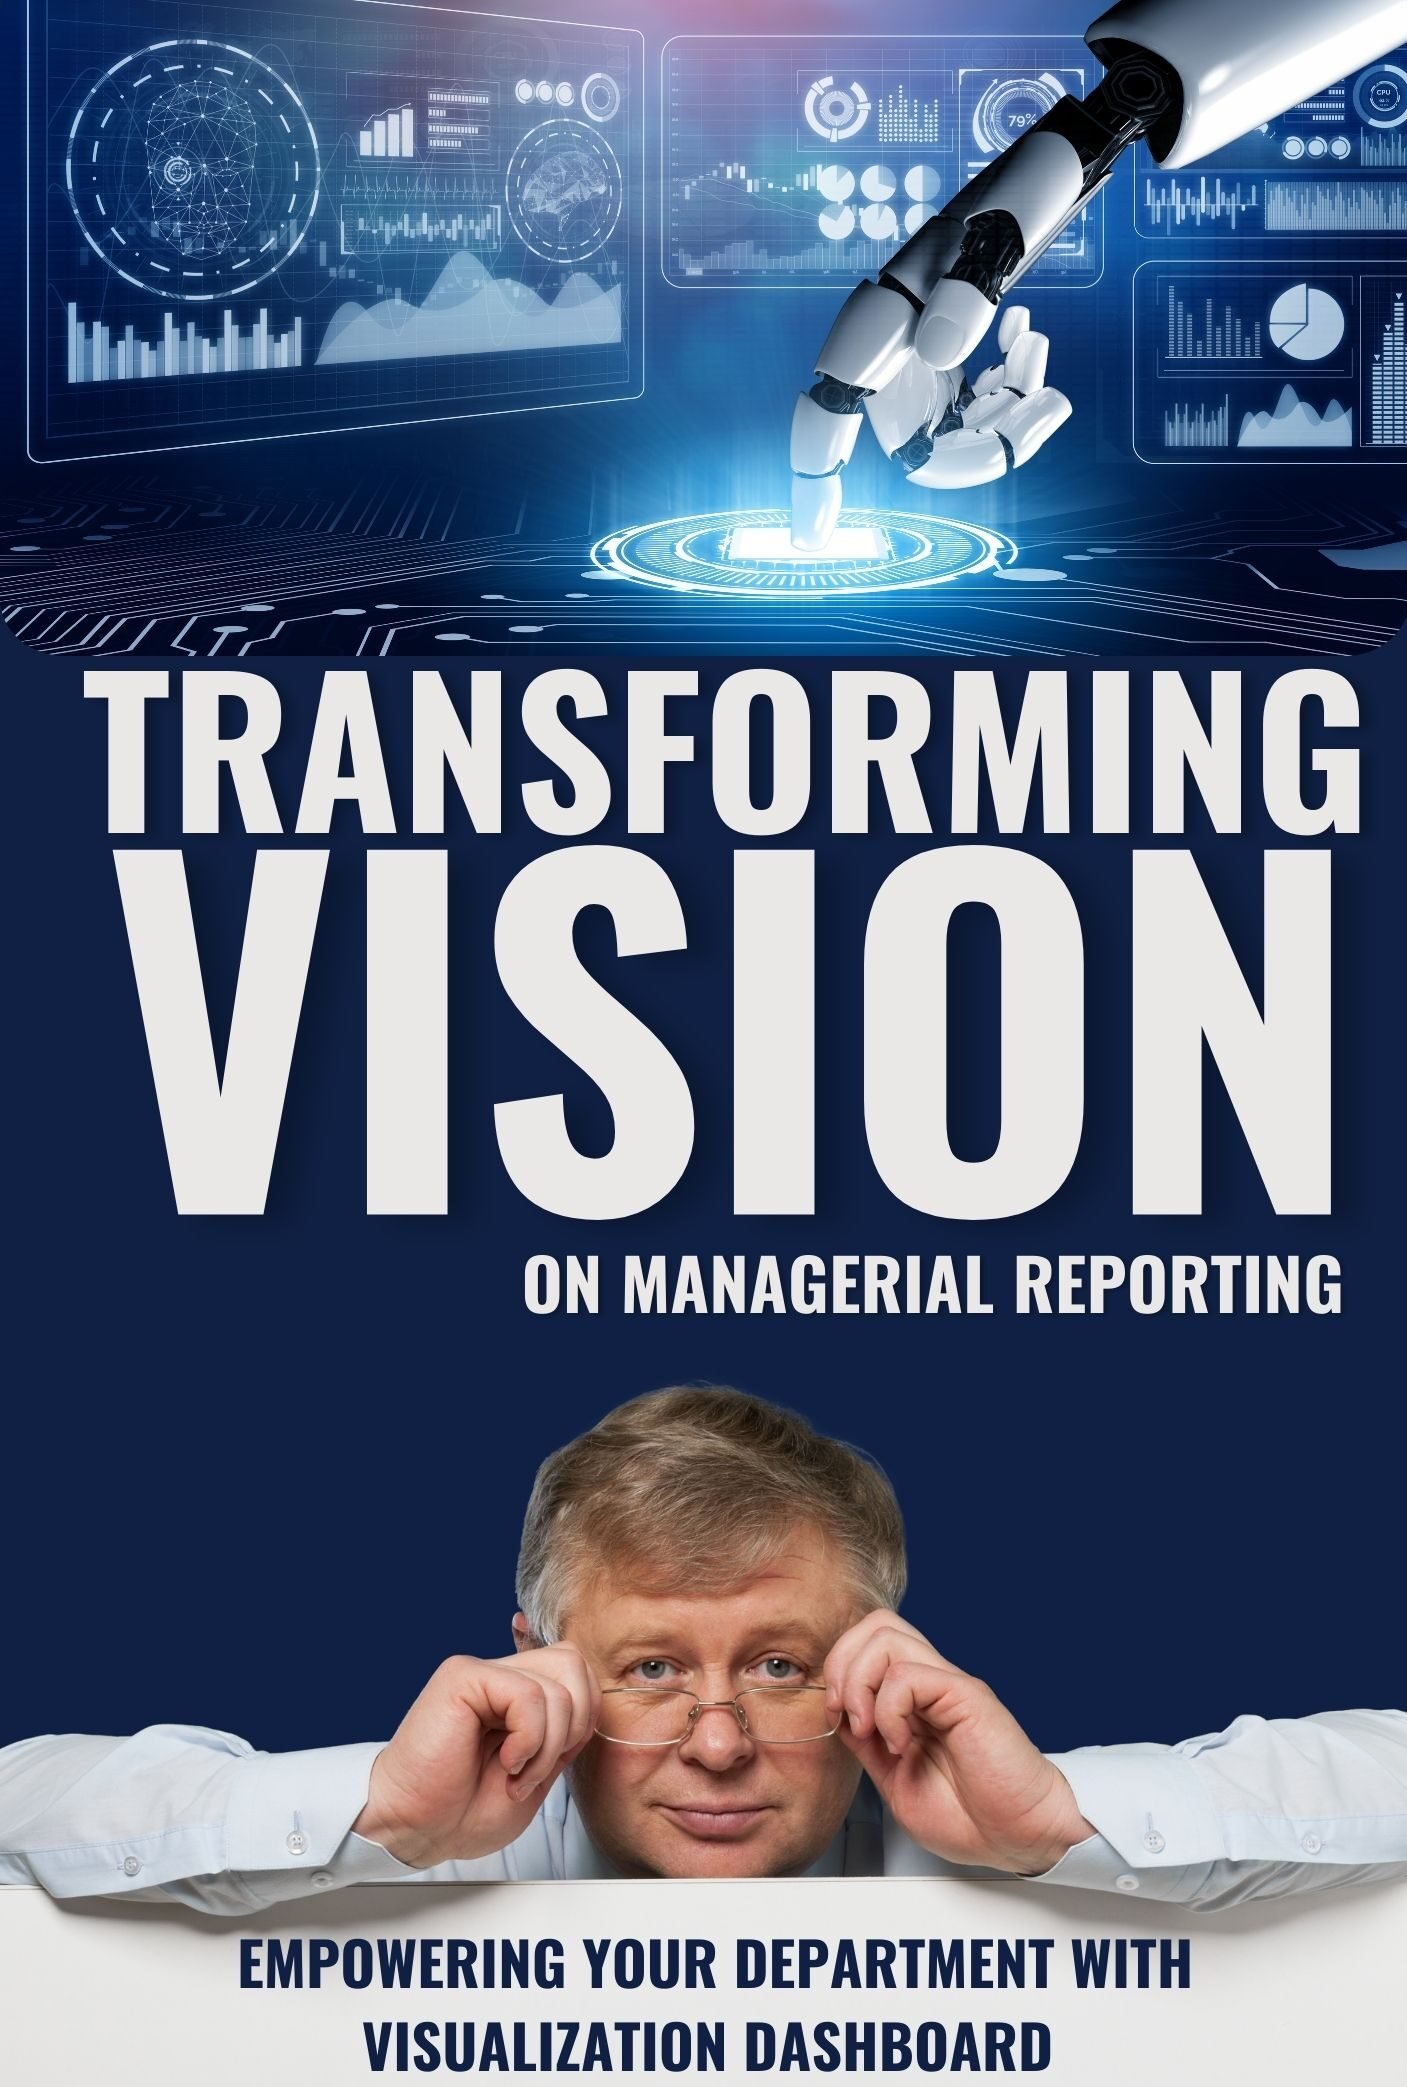
Transforming Vision On Mangerial Reporting
Join us in building a data-driven culture where every level of your organization leverages the power of information. Our interactive dashboards become an extension of your strategic thinking, enabling informed decisions at every turn. We’re not just dashboard creators; we’re your partner in crafting a sustainable, data-driven future. Let’s transform data from a burden into the fuel that propels your company towards exceptional growth.
GET STARTED NOW


